Quantitative Analyst Resume

These Quantitative Analyst resume samples are designed to help you write a resume that gets noticed by hiring managers and passes applicant tracking systems (ATS) in Data & Analytics. Each example shows real formatting, section structure, and language you can adapt to your own background. When writing your own Quantitative Analyst resume, focus on highlighting SQL & database querying, python / r for data analysis and machine learning & statistical modeling. Recruiters scan for these qualifications first, so they should appear early in your summary and experience sections. Use strong action verbs such as "analyzed", "modeled", "visualized", "optimized" to describe your achievements, and quantify your impact wherever possible — percentages, dollar amounts, or time saved make your resume more convincing. A common mistake to avoid: writing a generic objective statement instead of a targeted quantitative analyst professional summary. Tailor your resume to each Quantitative Analyst position you apply for rather than using one generic version.

Quantitative Analyst Resume Template
View PDF
0.0 (0 ratings)

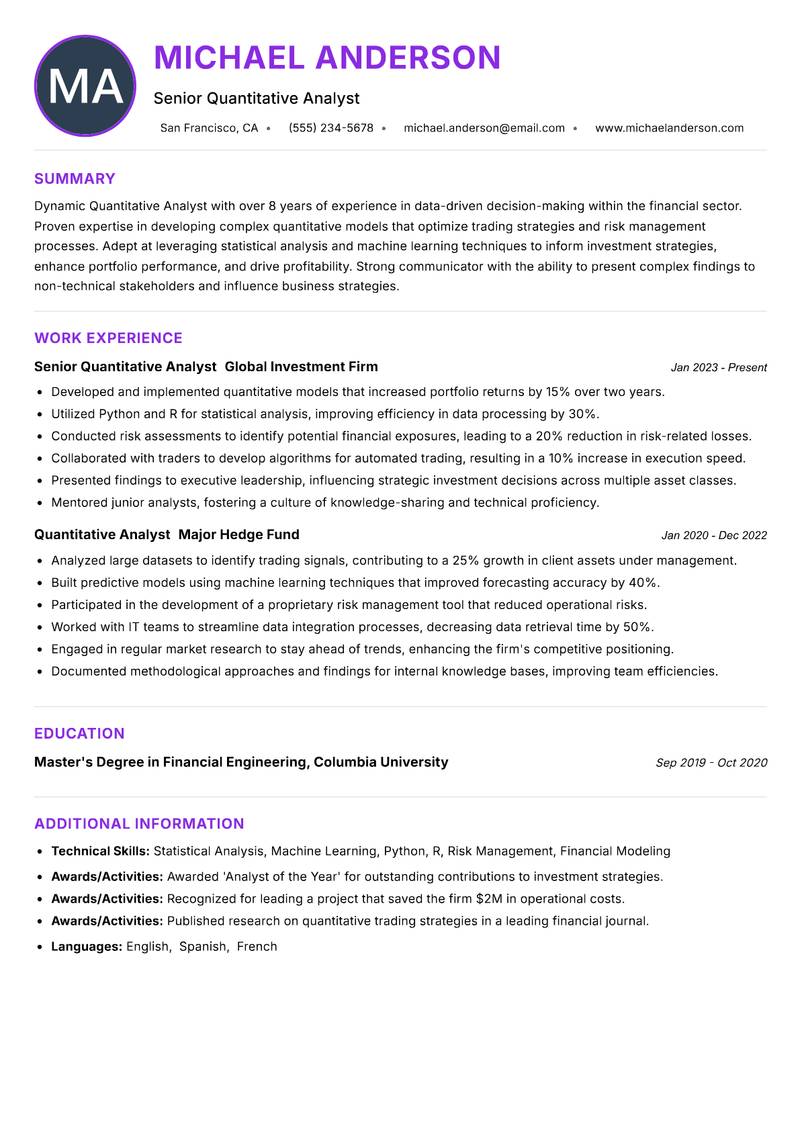
Senior Quantitative Analyst Resume

Dynamic Quantitative Analyst with over 8 years of experience in data-driven decision-making within the financial sector. Proven expertise in developing complex quantitative models that optimize trading strategies and risk management processes. Adept at leveraging statistical analysis and machine learning techniques to inform investment strategies, enhance portfolio performance, and drive profitability. Strong communicator with the ability to present complex findings to non-technical stakeholders and influence business strategies. Experienced in collaborating with cross-functional teams to enhance analytical capabilities and implement advanced analytical solutions. Committed to continuous professional development, regularly participating in industry conferences and pursuing advanced certifications in quantitative finance.

Statistical Analysis Machine Learning Python R Risk Management Financial Modeling
Quantitative Analyst Resume Preview Example
View PDF
  1. Developed and implemented quantitative models that increased portfolio returns by 15% over two years.
  2. Utilized Python and R for statistical analysis, improving efficiency in data processing by 30%.
  3. Conducted risk assessments to identify potential financial exposures, leading to a 20% reduction in risk-related losses.
  4. Collaborated with traders to develop algorithms for automated trading, resulting in a 10% increase in execution speed.
  5. Presented findings to executive leadership, influencing strategic investment decisions across multiple asset classes.
  6. Mentored junior analysts, fostering a culture of knowledge-sharing and technical proficiency.
  1. Analyzed large datasets to identify trading signals, contributing to a 25% growth in client assets under management.
  2. Built predictive models using machine learning techniques that improved forecasting accuracy by 40%.
  3. Participated in the development of a proprietary risk management tool that reduced operational risks.
  4. Worked with IT teams to streamline data integration processes, decreasing data retrieval time by 50%.
  5. Engaged in regular market research to stay ahead of trends, enhancing the firm's competitive positioning.
  6. Documented methodological approaches and findings for internal knowledge bases, improving team efficiencies.

Achievements

  • Awarded 'Analyst of the Year' for outstanding contributions to investment strategies.
  • Recognized for leading a project that saved the firm $2M in operational costs.
  • Published research on quantitative trading strategies in a leading financial journal.
⏱️
Experience
2-5 Years
📅
Level
Mid Level
🎓
Education
Master's Degree in Financial E...

Quantitative Analyst Resume

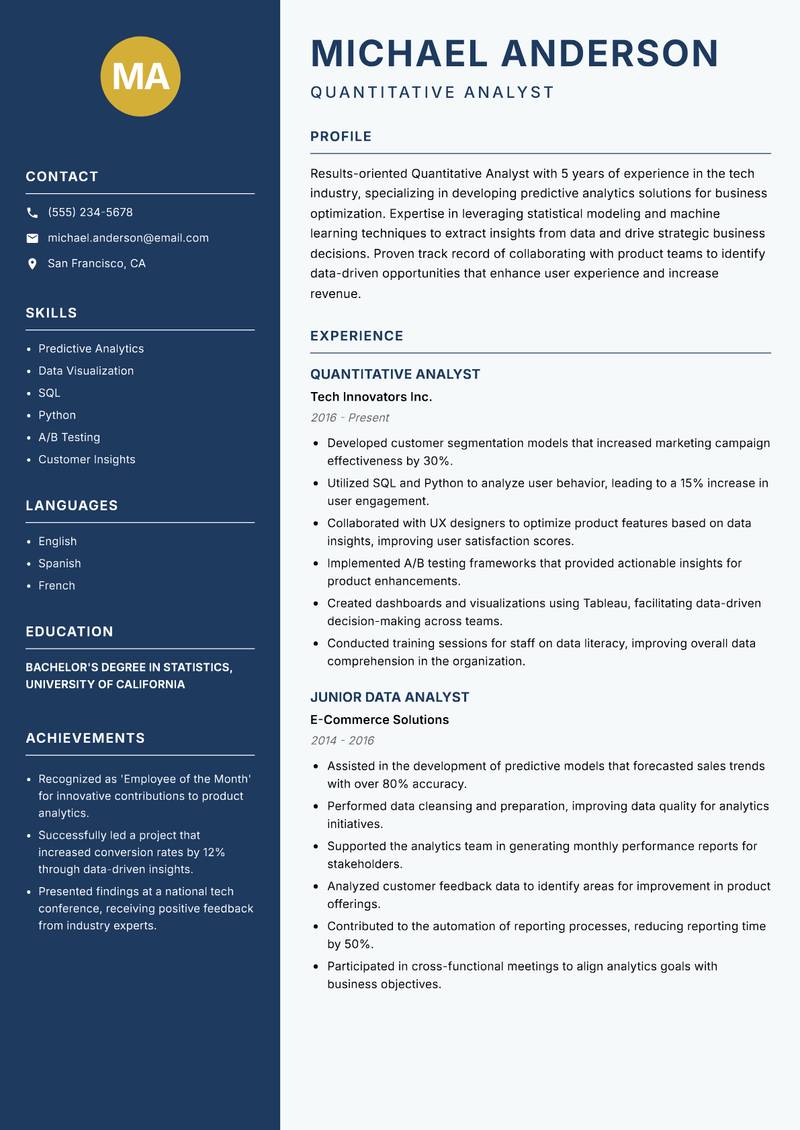
Accomplished Quantitative Analyst with 5 years of experience in the tech industry, specializing in developing predictive analytics solutions for business optimization. Expertise in leveraging statistical modeling and machine learning techniques to extract insights from data and drive strategic business decisions. Proven track record of collaborating with product teams to identify data-driven opportunities that enhance user experience and increase revenue. Excellent skills in data visualization and communication, ensuring complex analysis is accessible to diverse audiences. Passionate about utilizing data to solve real-world problems and continuously learning new technologies to stay ahead in the fast-paced tech landscape.

Predictive Analytics Data Visualization SQL Python A/B Testing Customer Insights
Quantitative Analyst Resume Preview Example
View PDF
  1. Developed customer segmentation models that increased marketing campaign effectiveness by 30%.
  2. Utilized SQL and Python to analyze user behavior, leading to a 15% increase in user engagement.
  3. Collaborated with UX designers to optimize product features based on data insights, improving user satisfaction scores.
  4. Implemented A/B testing frameworks that provided actionable insights for product enhancements.
  5. Created dashboards and visualizations using Tableau, facilitating data-driven decision-making across teams.
  6. Conducted training sessions for staff on data literacy, improving overall data comprehension in the organization.
  1. Assisted in the development of predictive models that forecasted sales trends with over 80% accuracy.
  2. Performed data cleansing and preparation, improving data quality for analytics initiatives.
  3. Supported the analytics team in generating monthly performance reports for stakeholders.
  4. Analyzed customer feedback data to identify areas for improvement in product offerings.
  5. Contributed to the automation of reporting processes, reducing reporting time by 50%.
  6. Participated in cross-functional meetings to align analytics goals with business objectives.

Achievements

  • Recognized as 'Employee of the Month' for innovative contributions to product analytics.
  • Successfully led a project that increased conversion rates by 12% through data-driven insights.
  • Presented findings at a national tech conference, receiving positive feedback from industry experts.
⏱️
Experience
2-5 Years
📅
Level
Mid Level
🎓
Education
Bachelor's Degree in Statistic...

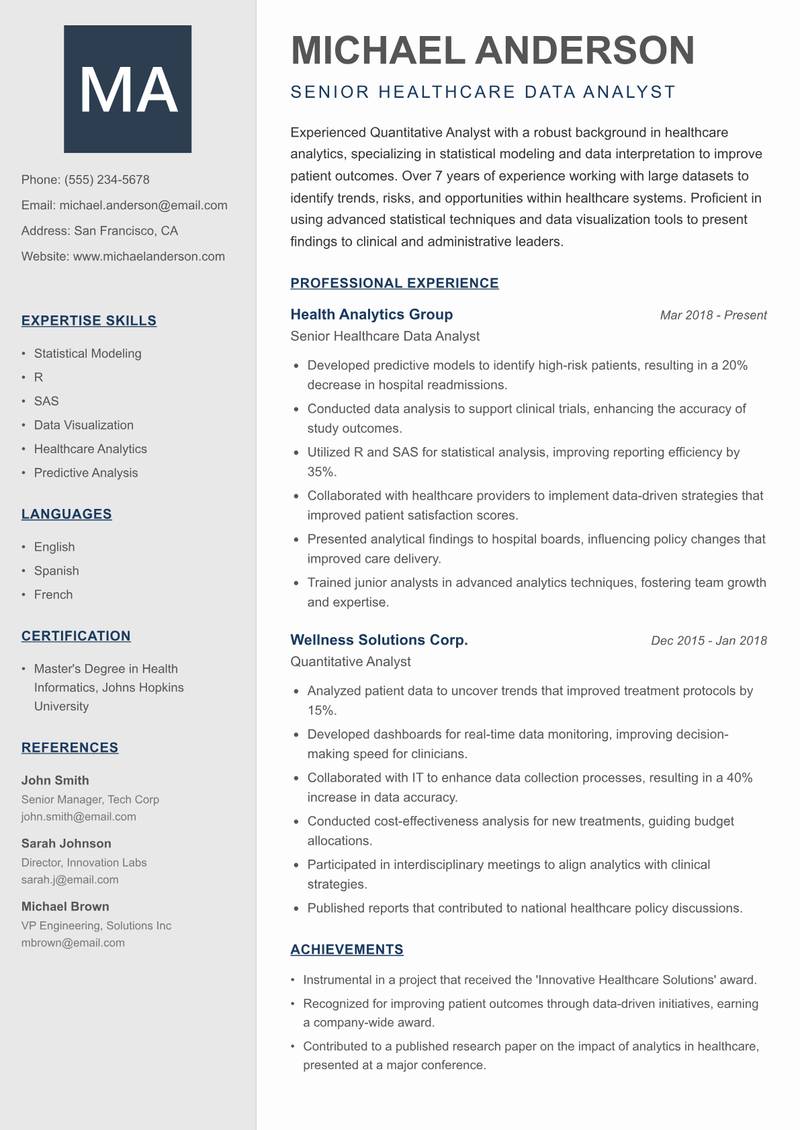
Senior Healthcare Data Analyst Resume

Experienced Quantitative Analyst with a robust background in healthcare analytics, specializing in statistical modeling and data interpretation to improve patient outcomes. Over 7 years of experience working with large datasets to identify trends, risks, and opportunities within healthcare systems. Proficient in using advanced statistical techniques and data visualization tools to present findings to clinical and administrative leaders. A collaborative team player dedicated to enhancing the quality of care through data-driven insights and innovative solutions. Committed to ongoing learning and application of best practices in the evolving landscape of healthcare analytics.

Statistical Modeling R SAS Data Visualization Healthcare Analytics Predictive Analysis
Quantitative Analyst Resume Preview Example
View PDF
  1. Developed predictive models to identify high-risk patients, resulting in a 20% decrease in hospital readmissions.
  2. Conducted data analysis to support clinical trials, enhancing the accuracy of study outcomes.
  3. Utilized R and SAS for statistical analysis, improving reporting efficiency by 35%.
  4. Collaborated with healthcare providers to implement data-driven strategies that improved patient satisfaction scores.
  5. Presented analytical findings to hospital boards, influencing policy changes that improved care delivery.
  6. Trained junior analysts in advanced analytics techniques, fostering team growth and expertise.
  1. Analyzed patient data to uncover trends that improved treatment protocols by 15%.
  2. Developed dashboards for real-time data monitoring, improving decision-making speed for clinicians.
  3. Collaborated with IT to enhance data collection processes, resulting in a 40% increase in data accuracy.
  4. Conducted cost-effectiveness analysis for new treatments, guiding budget allocations.
  5. Participated in interdisciplinary meetings to align analytics with clinical strategies.
  6. Published reports that contributed to national healthcare policy discussions.

Achievements

  • Instrumental in a project that received the 'Innovative Healthcare Solutions' award.
  • Recognized for improving patient outcomes through data-driven initiatives, earning a company-wide award.
  • Contributed to a published research paper on the impact of analytics in healthcare, presented at a major conference.
⏱️
Experience
2-5 Years
📅
Level
Mid Level
🎓
Education
Master's Degree in Health Info...

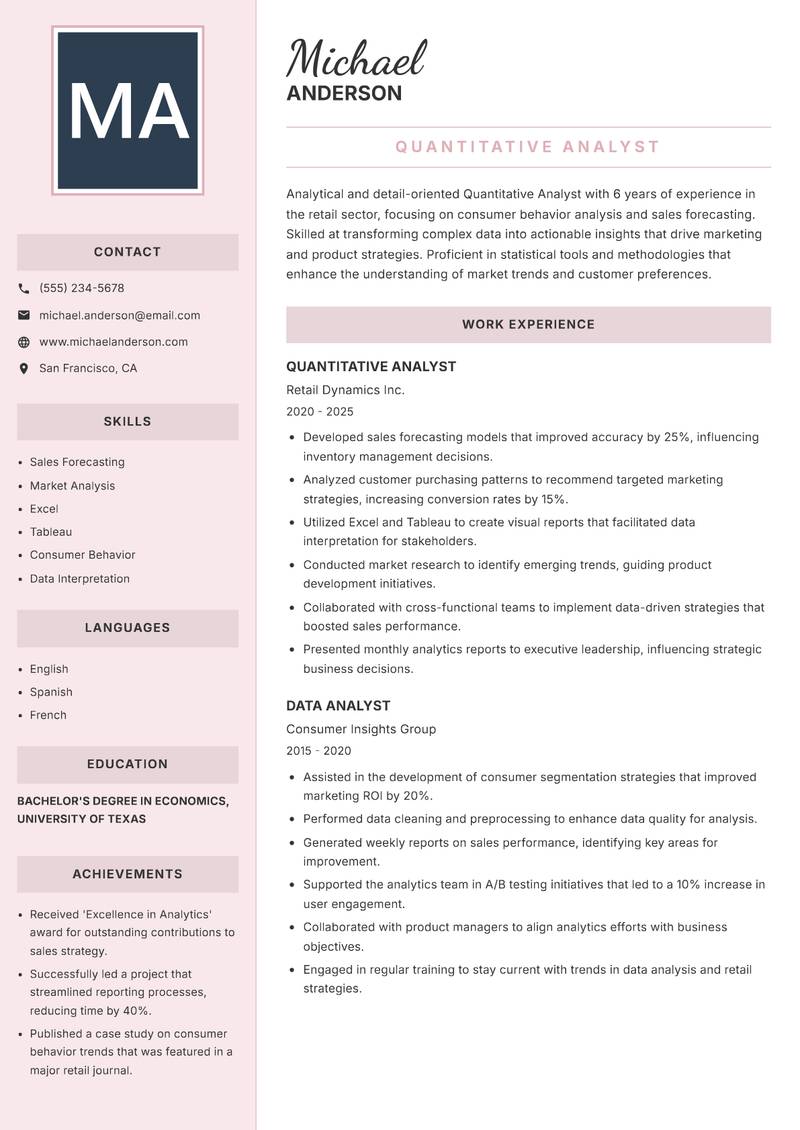
Quantitative Analyst Resume

Analytical and detail-oriented Quantitative Analyst with 6 years of experience in the retail sector, focusing on consumer behavior analysis and sales forecasting. Skilled at transforming complex data into actionable insights that drive marketing and product strategies. Proficient in statistical tools and methodologies that enhance the understanding of market trends and customer preferences. A team-oriented professional with a passion for leveraging data to optimize business performance and achieve competitive advantages. Dedicated to continuous improvement and the adoption of advanced analytics techniques to better serve organizational goals.

Sales Forecasting Market Analysis Excel Tableau Consumer Behavior Data Interpretation
Quantitative Analyst Resume Preview Example
View PDF
  1. Developed sales forecasting models that improved accuracy by 25%, influencing inventory management decisions.
  2. Analyzed customer purchasing patterns to recommend targeted marketing strategies, increasing conversion rates by 15%.
  3. Utilized Excel and Tableau to create visual reports that facilitated data interpretation for stakeholders.
  4. Conducted market research to identify emerging trends, guiding product development initiatives.
  5. Collaborated with cross-functional teams to implement data-driven strategies that boosted sales performance.
  6. Presented monthly analytics reports to executive leadership, influencing strategic business decisions.
  1. Assisted in the development of consumer segmentation strategies that improved marketing ROI by 20%.
  2. Performed data cleaning and preprocessing to enhance data quality for analysis.
  3. Generated weekly reports on sales performance, identifying key areas for improvement.
  4. Supported the analytics team in A/B testing initiatives that led to a 10% increase in user engagement.
  5. Collaborated with product managers to align analytics efforts with business objectives.
  6. Engaged in regular training to stay current with trends in data analysis and retail strategies.

Achievements

  • Received 'Excellence in Analytics' award for outstanding contributions to sales strategy.
  • Successfully led a project that streamlined reporting processes, reducing time by 40%.
  • Published a case study on consumer behavior trends that was featured in a major retail journal.
⏱️
Experience
2-5 Years
📅
Level
Mid Level
🎓
Education
Bachelor's Degree in Economics...

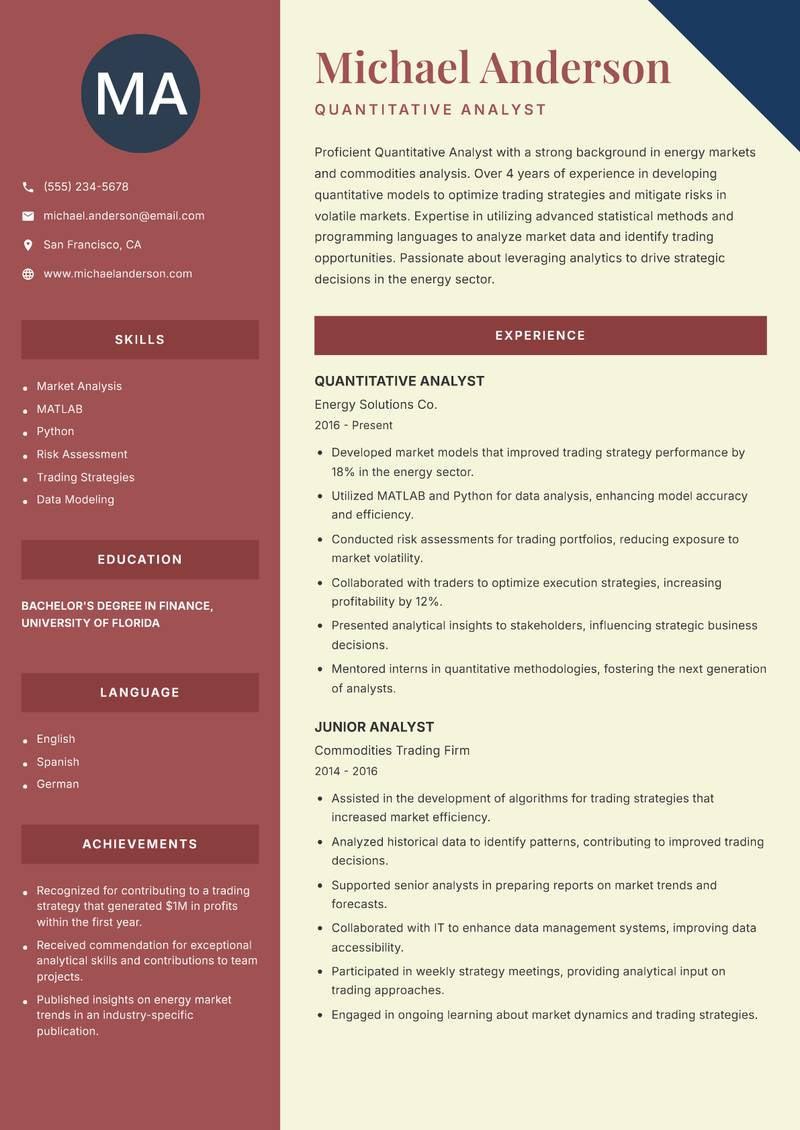
Quantitative Analyst Resume

Proficient Quantitative Analyst with a strong background in energy markets and commodities analysis. Over 4 years of experience in developing quantitative models to optimize trading strategies and mitigate risks in volatile markets. Expertise in utilizing advanced statistical methods and programming languages to analyze market data and identify trading opportunities. Passionate about leveraging analytics to drive strategic decisions in the energy sector. A proactive team player with excellent communication skills, dedicated to fostering collaboration across departments to achieve organizational goals.

Market Analysis MATLAB Python Risk Assessment Trading Strategies Data Modeling
Quantitative Analyst Resume Preview Example
View PDF
  1. Developed market models that improved trading strategy performance by 18% in the energy sector.
  2. Utilized MATLAB and Python for data analysis, enhancing model accuracy and efficiency.
  3. Conducted risk assessments for trading portfolios, reducing exposure to market volatility.
  4. Collaborated with traders to optimize execution strategies, increasing profitability by 12%.
  5. Presented analytical insights to stakeholders, influencing strategic business decisions.
  6. Mentored interns in quantitative methodologies, fostering the next generation of analysts.
  1. Assisted in the development of algorithms for trading strategies that increased market efficiency.
  2. Analyzed historical data to identify patterns, contributing to improved trading decisions.
  3. Supported senior analysts in preparing reports on market trends and forecasts.
  4. Collaborated with IT to enhance data management systems, improving data accessibility.
  5. Participated in weekly strategy meetings, providing analytical input on trading approaches.
  6. Engaged in ongoing learning about market dynamics and trading strategies.

Achievements

  • Recognized for contributing to a trading strategy that generated $1M in profits within the first year.
  • Received commendation for exceptional analytical skills and contributions to team projects.
  • Published insights on energy market trends in an industry-specific publication.
⏱️
Experience
2-5 Years
📅
Level
Mid Level
🎓
Education
Bachelor's Degree in Finance, ...

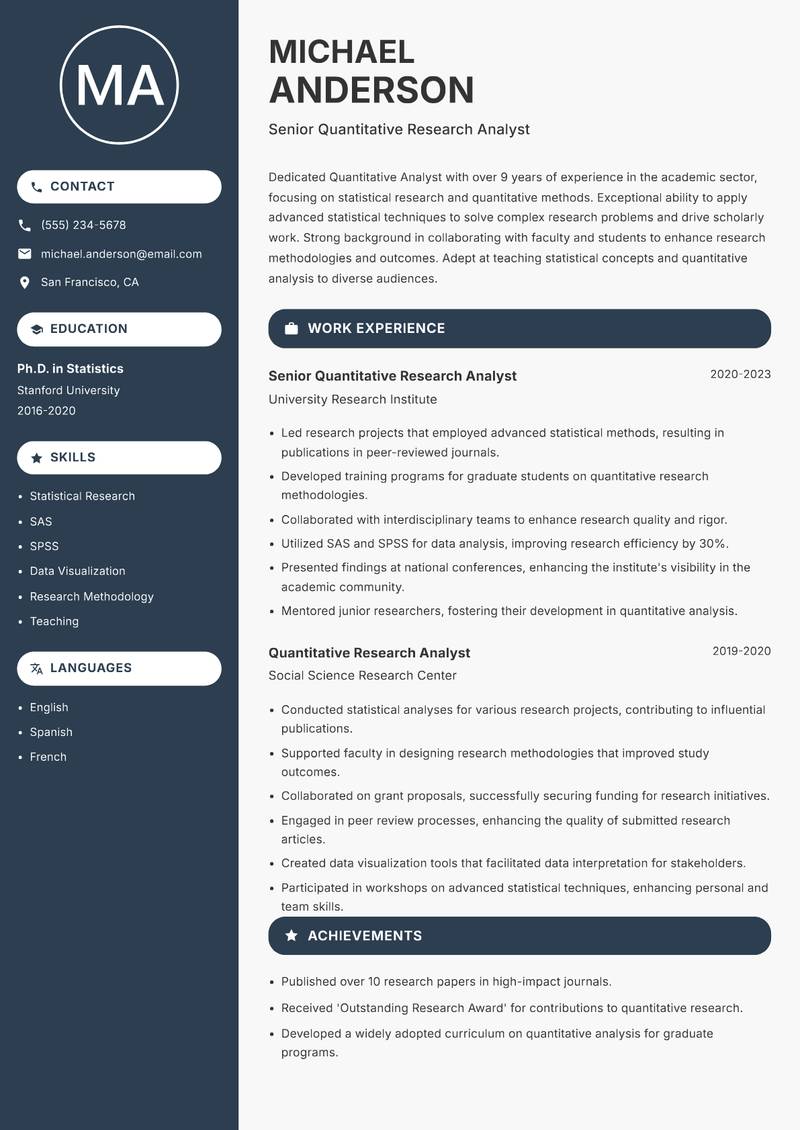
Senior Quantitative Research Analyst Resume

Dedicated Quantitative Analyst with over 9 years of experience in the academic sector, focusing on statistical research and quantitative methods. Exceptional ability to apply advanced statistical techniques to solve complex research problems and drive scholarly work. Strong background in collaborating with faculty and students to enhance research methodologies and outcomes. Adept at teaching statistical concepts and quantitative analysis to diverse audiences. Committed to advancing the field of quantitative research through rigorous analysis and innovative methodologies.

Statistical Research SAS SPSS Data Visualization Research Methodology Teaching
Quantitative Analyst Resume Preview Example
View PDF
  1. Led research projects that employed advanced statistical methods, resulting in publications in peer-reviewed journals.
  2. Developed training programs for graduate students on quantitative research methodologies.
  3. Collaborated with interdisciplinary teams to enhance research quality and rigor.
  4. Utilized SAS and SPSS for data analysis, improving research efficiency by 30%.
  5. Presented findings at national conferences, enhancing the institute's visibility in the academic community.
  6. Mentored junior researchers, fostering their development in quantitative analysis.
  1. Conducted statistical analyses for various research projects, contributing to influential publications.
  2. Supported faculty in designing research methodologies that improved study outcomes.
  3. Collaborated on grant proposals, successfully securing funding for research initiatives.
  4. Engaged in peer review processes, enhancing the quality of submitted research articles.
  5. Created data visualization tools that facilitated data interpretation for stakeholders.
  6. Participated in workshops on advanced statistical techniques, enhancing personal and team skills.

Achievements

  • Published over 10 research papers in high-impact journals.
  • Received 'Outstanding Research Award' for contributions to quantitative research.
  • Developed a widely adopted curriculum on quantitative analysis for graduate programs.
⏱️
Experience
2-5 Years
📅
Level
Mid Level
🎓
Education
Ph.D. in Statistics, Stanford ...

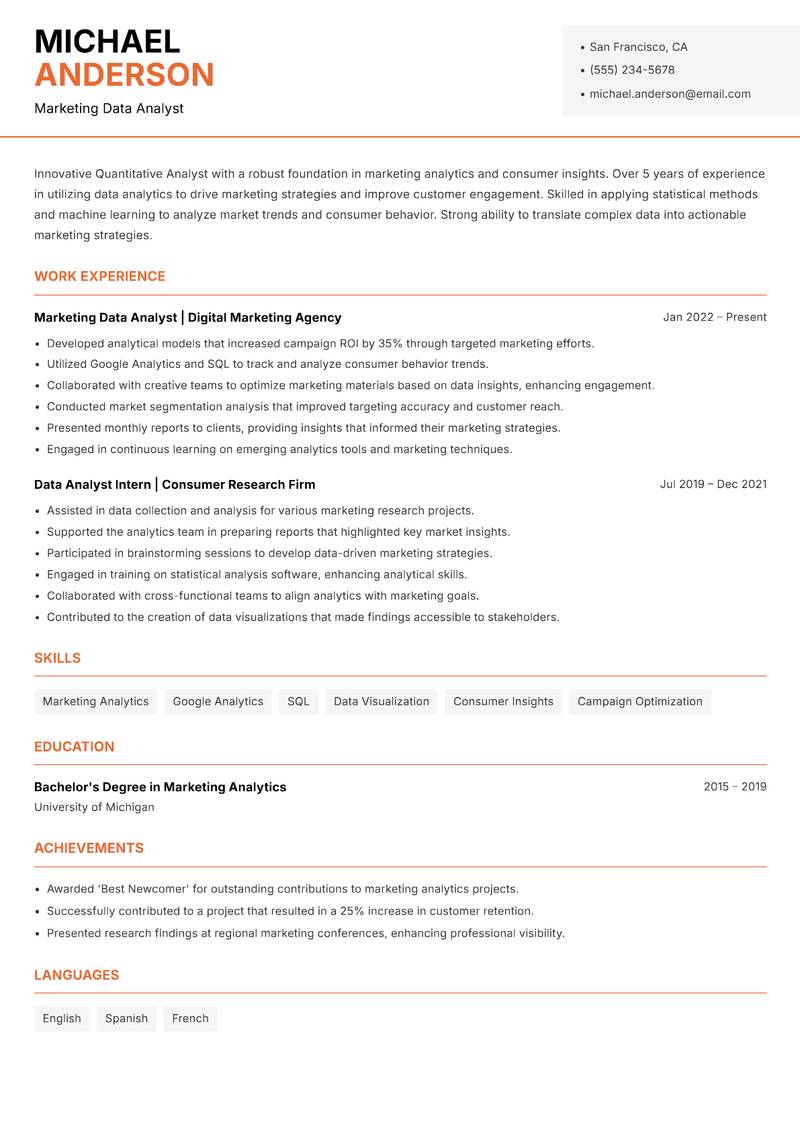
Marketing Data Analyst Resume

Innovative Quantitative Analyst with a robust foundation in marketing analytics and consumer insights. Over 5 years of experience in utilizing data analytics to drive marketing strategies and improve customer engagement. Skilled in applying statistical methods and machine learning to analyze market trends and consumer behavior. Strong ability to translate complex data into actionable marketing strategies. A collaborative team member dedicated to enhancing brand performance through data-driven insights and continuous improvement in marketing practices.

Marketing Analytics Google Analytics SQL Data Visualization Consumer Insights Campaign Optimization
Quantitative Analyst Resume Preview Example
View PDF
  1. Developed analytical models that increased campaign ROI by 35% through targeted marketing efforts.
  2. Utilized Google Analytics and SQL to track and analyze consumer behavior trends.
  3. Collaborated with creative teams to optimize marketing materials based on data insights, enhancing engagement.
  4. Conducted market segmentation analysis that improved targeting accuracy and customer reach.
  5. Presented monthly reports to clients, providing insights that informed their marketing strategies.
  6. Engaged in continuous learning on emerging analytics tools and marketing techniques.
  1. Assisted in data collection and analysis for various marketing research projects.
  2. Supported the analytics team in preparing reports that highlighted key market insights.
  3. Participated in brainstorming sessions to develop data-driven marketing strategies.
  4. Engaged in training on statistical analysis software, enhancing analytical skills.
  5. Collaborated with cross-functional teams to align analytics with marketing goals.
  6. Contributed to the creation of data visualizations that made findings accessible to stakeholders.

Achievements

  • Awarded 'Best Newcomer' for outstanding contributions to marketing analytics projects.
  • Successfully contributed to a project that resulted in a 25% increase in customer retention.
  • Presented research findings at regional marketing conferences, enhancing professional visibility.
⏱️
Experience
2-5 Years
📅
Level
Mid Level
🎓
Education
Bachelor's Degree in Marketing...

Key Skills for Quantitative Analyst Positions

Resume Tips for Quantitative Analyst Applications

Strong Action Verbs for Quantitative Analyst Resumes

Analyzed · Modeled · Visualized · Optimized · Forecasted · Engineered · Extracted · Transformed · Predicted · Dashboarded · Achieved · Administered · Architected · Assessed

Common Mistakes to Avoid

Experience Levels

How to Write a Quantitative Analyst Resume

Browse Quantitative Analyst resume examples built around SQL & database querying, tailored for Data & Analytics roles.

A strong Quantitative Analyst resume leads with a focused professional summary that names the exact role and your standout achievement. In the experience section, open every bullet with a strong action verb and quantify the result with numbers wherever possible. Highlight your most relevant competencies — especially SQL & Database Querying, Python / R for Data Analysis, and Machine Learning & Statistical Modeling — in a dedicated Skills section positioned early so ATS systems and hiring managers both find it immediately.

For format, most Quantitative Analyst roles suit a reverse-chronological layout: most recent position first, working backwards. Keep to one page for under five years of experience, or two pages for senior candidates with a rich project or leadership history. Use clean, ATS-safe fonts (10–12pt), standard section headings (Summary, Experience, Education, Skills), and avoid tables, text boxes, or multi-column layouts that applicant tracking systems cannot parse reliably.
Frequently Asked Questions

What makes a strong Quantitative Analyst resume stand out to employers?

A standout Quantitative Analyst resume combines role-specific skills with quantified achievements. Name the exact job title in your professional summary, mirror keywords from each job posting, and open every bullet point with a strong action verb followed by a measurable result. Certifications, tools, and domain experience specific to quantitative analyst roles should appear prominently near the top.

What skills are most important to include on a Data & Analytics resume?

Recruiters hiring in Data & Analytics consistently look for SQL & Database Querying, Python / R for Data Analysis, Machine Learning & Statistical Modeling, Data Visualization (Tableau, Power BI, Looker). List these in a dedicated Skills section near the top so both ATS systems and human reviewers spot them fast. Mirror the exact phrasing from each job posting wherever possible — many applicant tracking systems match literal strings rather than synonyms.

What is the best resume format for Data & Analytics professionals?

A reverse-chronological format is the standard choice for most Data & Analytics candidates — employers expect to see your most recent role first, working backwards. If you are transitioning into Data & Analytics from a related field, a hybrid format (brief skills summary at the top followed by chronological experience) can bridge the gap effectively. Keep the document to one page for under five years of experience, or two pages for senior specialists.

How do I make my Data & Analytics resume pass applicant tracking systems (ATS)?

Use standard section headings — Summary, Experience, Education, Skills — rather than creative labels that ATS parsers do not recognise. Embed domain keywords such as "SQL & Database Querying" and "Python / R for Data Analysis" naturally inside your experience bullets rather than cramming them into a standalone keyword list. Avoid tables, multi-column layouts, text boxes, headers, footers, and images — these confuse most modern parsers and can cause your resume to be misread or rejected before a human sees it.

What mistakes do Data & Analytics professionals most commonly make on their resume?

The most frequent issue is describing technical processes without tying them to business outcomes. Beyond that, generic objective statements, unquantified achievements, and inconsistent date formatting appear across almost every Data & Analytics application. Fix these by replacing every vague claim with a measurable outcome — specific numbers and named projects add credibility that adjectives cannot.

How long should a Data & Analytics resume be?

One page is appropriate for candidates with under five years of relevant Data & Analytics experience. Two pages are acceptable — and sometimes expected — for senior specialists, managers, or professionals with a strong portfolio of projects, publications, or credentials. Avoid padding to reach a page count: every line should directly support your application for the specific role you are targeting.

Should I include a professional summary at the top of my Data & Analytics resume?

Yes — a two to three sentence summary is the first section most recruiters read. Open with your title and years of Data & Analytics experience, then name your most relevant achievement or specialisation. One proven approach: Quantify every analytical outcome — revenue impact, cost savings, accuracy improvements, or decisions influenced — this level of specificity signals genuine expertise before a recruiter reaches your experience section.

Scroll to view samples