Dashboard Developer Resume

These Dashboard Developer resume samples are designed to help you write a resume that gets noticed by hiring managers and passes applicant tracking systems (ATS) in Data & Analytics. Each example shows real formatting, section structure, and language you can adapt to your own background. When writing your own Dashboard Developer resume, focus on highlighting SQL & database querying, python / r for data analysis and machine learning & statistical modeling. Recruiters scan for these qualifications first, so they should appear early in your summary and experience sections. Use strong action verbs such as "analyzed", "modeled", "visualized", "optimized" to describe your achievements, and quantify your impact wherever possible — percentages, dollar amounts, or time saved make your resume more convincing. A common mistake to avoid: writing a generic objective statement instead of a targeted dashboard developer professional summary. Tailor your resume to each Dashboard Developer position you apply for rather than using one generic version.

Dashboard Developer Resume Template
View PDF
0.0 (0 ratings)

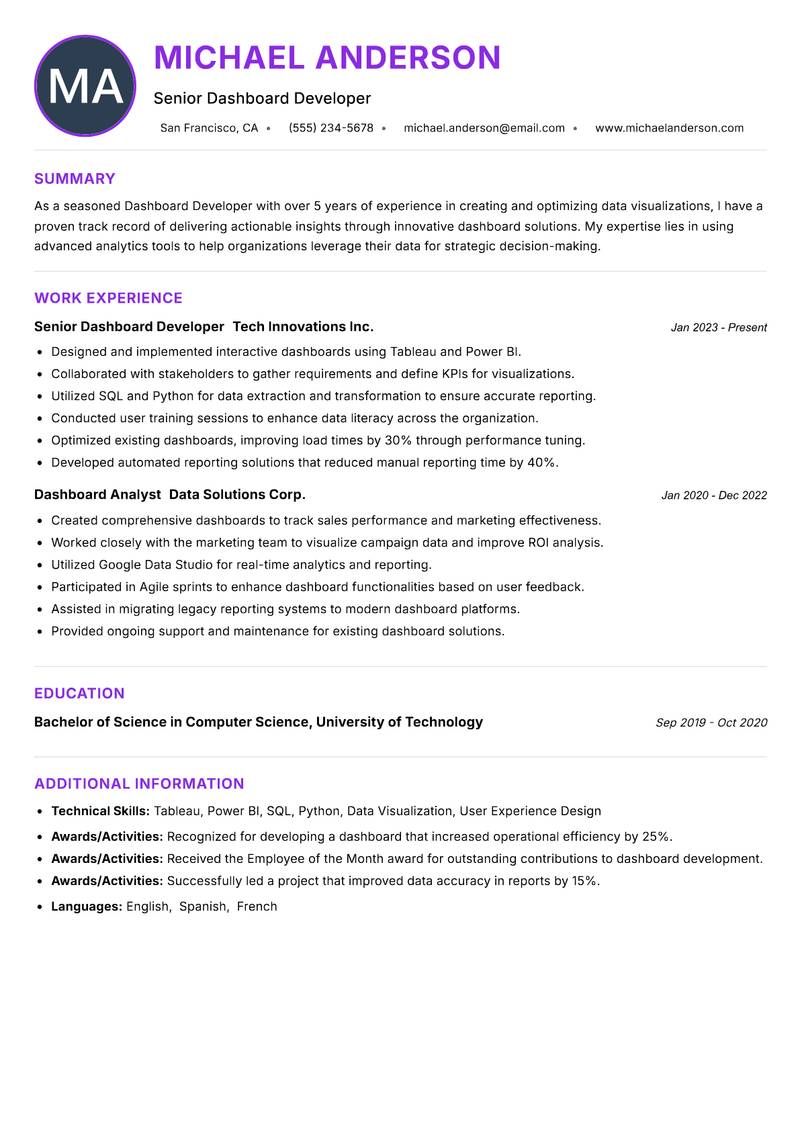
Senior Dashboard Developer Resume

As a seasoned Dashboard Developer with over 5 years of experience in creating and optimizing data visualizations, I have a proven track record of delivering actionable insights through innovative dashboard solutions. My expertise lies in using advanced analytics tools to help organizations leverage their data for strategic decision-making. I have collaborated with cross-functional teams to define key performance indicators (KPIs) and develop dashboards that effectively communicate data trends and business performance. My strong analytical skills, combined with a keen understanding of user experience design principles, have enabled me to build intuitive and engaging dashboard interfaces that enhance user engagement and data comprehension. I am passionate about data storytelling and constantly seek to improve the user experience through iterative design processes. My goal is to empower businesses to transform their data into meaningful insights that drive growth and operational efficiency.

Tableau Power BI SQL Python Data Visualization User Experience Design
Dashboard Developer Resume Preview Example
View PDF
  1. Designed and implemented interactive dashboards using Tableau and Power BI.
  2. Collaborated with stakeholders to gather requirements and define KPIs for visualizations.
  3. Utilized SQL and Python for data extraction and transformation to ensure accurate reporting.
  4. Conducted user training sessions to enhance data literacy across the organization.
  5. Optimized existing dashboards, improving load times by 30% through performance tuning.
  6. Developed automated reporting solutions that reduced manual reporting time by 40%.
  1. Created comprehensive dashboards to track sales performance and marketing effectiveness.
  2. Worked closely with the marketing team to visualize campaign data and improve ROI analysis.
  3. Utilized Google Data Studio for real-time analytics and reporting.
  4. Participated in Agile sprints to enhance dashboard functionalities based on user feedback.
  5. Assisted in migrating legacy reporting systems to modern dashboard platforms.
  6. Provided ongoing support and maintenance for existing dashboard solutions.

Achievements

  • Recognized for developing a dashboard that increased operational efficiency by 25%.
  • Received the Employee of the Month award for outstanding contributions to dashboard development.
  • Successfully led a project that improved data accuracy in reports by 15%.
⏱️
Experience
2-5 Years
📅
Level
Mid Level
🎓
Education
Bachelor of Science in Compute...

Dashboard Developer Resume

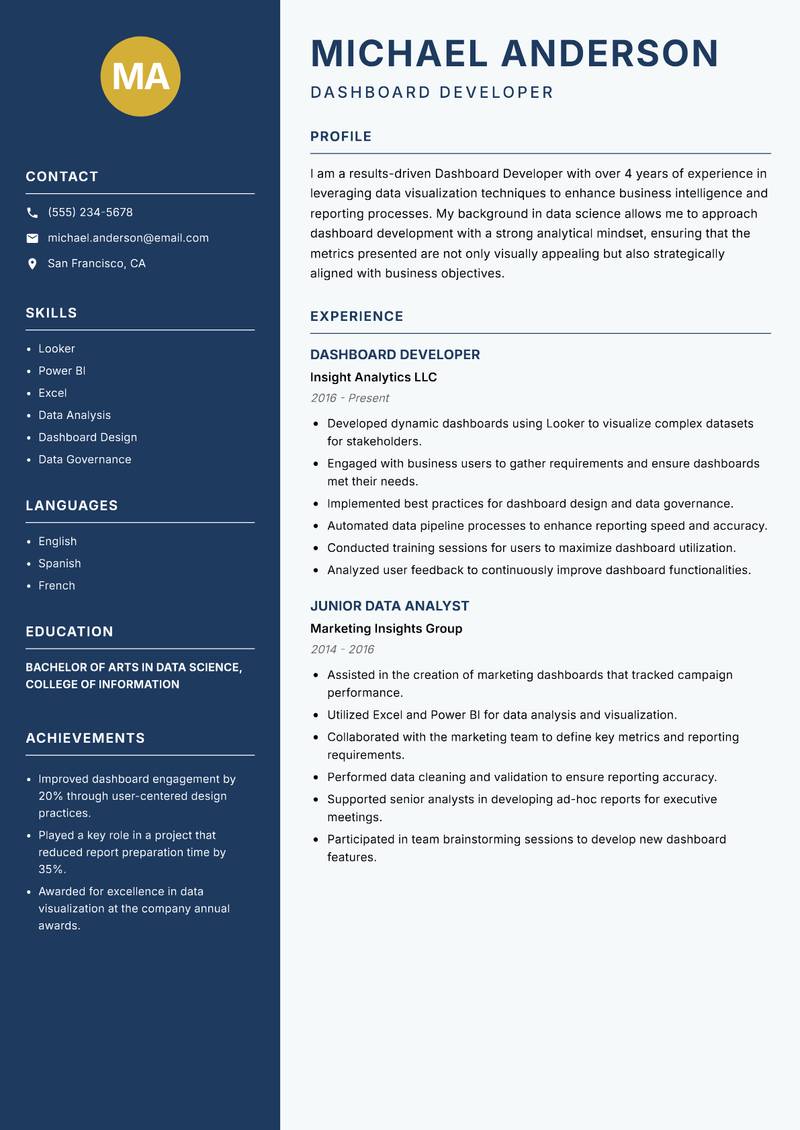
I am a results-driven Dashboard Developer with over 4 years of experience in leveraging data visualization techniques to enhance business intelligence and reporting processes. My background in data science allows me to approach dashboard development with a strong analytical mindset, ensuring that the metrics presented are not only visually appealing but also strategically aligned with business objectives. I have a strong command of tools like Looker and Microsoft Power BI, enabling me to create dashboards that provide real-time insights to decision-makers. My focus on user feedback and iterative design has led to the development of dashboards that are both functional and user-friendly. I thrive in collaborative environments where I can work closely with cross-functional teams to understand their needs and translate them into impactful data solutions.

Looker Power BI Excel Data Analysis Dashboard Design Data Governance
Dashboard Developer Resume Preview Example
View PDF
  1. Developed dynamic dashboards using Looker to visualize complex datasets for stakeholders.
  2. Engaged with business users to gather requirements and ensure dashboards met their needs.
  3. Implemented best practices for dashboard design and data governance.
  4. Automated data pipeline processes to enhance reporting speed and accuracy.
  5. Conducted training sessions for users to maximize dashboard utilization.
  6. Analyzed user feedback to continuously improve dashboard functionalities.
  1. Assisted in the creation of marketing dashboards that tracked campaign performance.
  2. Utilized Excel and Power BI for data analysis and visualization.
  3. Collaborated with the marketing team to define key metrics and reporting requirements.
  4. Performed data cleaning and validation to ensure reporting accuracy.
  5. Supported senior analysts in developing ad-hoc reports for executive meetings.
  6. Participated in team brainstorming sessions to develop new dashboard features.

Achievements

  • Improved dashboard engagement by 20% through user-centered design practices.
  • Played a key role in a project that reduced report preparation time by 35%.
  • Awarded for excellence in data visualization at the company annual awards.
⏱️
Experience
2-5 Years
📅
Level
Mid Level
🎓
Education
Bachelor of Arts in Data Scien...

Dashboard Developer Resume

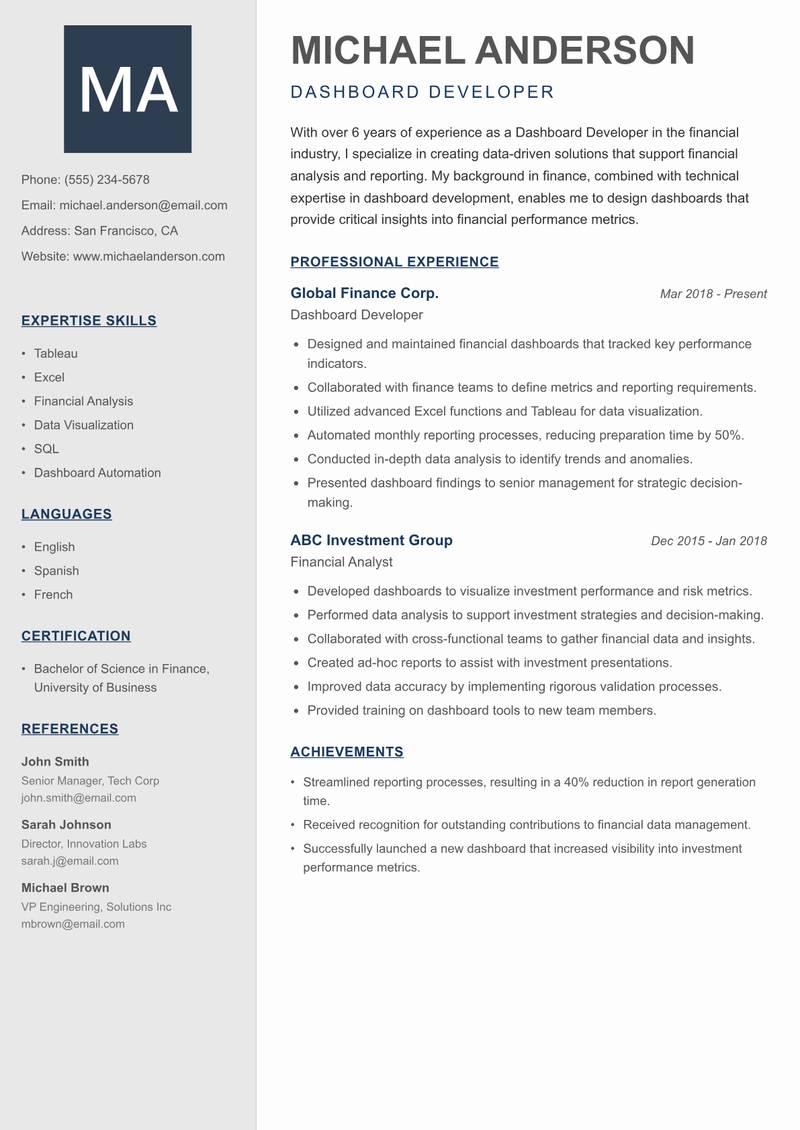
With over 6 years of experience as a Dashboard Developer in the financial industry, I specialize in creating data-driven solutions that support financial analysis and reporting. My background in finance, combined with technical expertise in dashboard development, enables me to design dashboards that provide critical insights into financial performance metrics. I have successfully led projects that integrate various data sources to create unified dashboards that enhance decision-making capabilities for finance teams. My strong analytical skills and attention to detail ensure that the dashboards I develop are accurate and actionable. I am committed to delivering high-quality solutions that align with organizational goals while improving the efficiency of financial reporting processes.

Tableau Excel Financial Analysis Data Visualization SQL Dashboard Automation
Dashboard Developer Resume Preview Example
View PDF
  1. Designed and maintained financial dashboards that tracked key performance indicators.
  2. Collaborated with finance teams to define metrics and reporting requirements.
  3. Utilized advanced Excel functions and Tableau for data visualization.
  4. Automated monthly reporting processes, reducing preparation time by 50%.
  5. Conducted in-depth data analysis to identify trends and anomalies.
  6. Presented dashboard findings to senior management for strategic decision-making.
  1. Developed dashboards to visualize investment performance and risk metrics.
  2. Performed data analysis to support investment strategies and decision-making.
  3. Collaborated with cross-functional teams to gather financial data and insights.
  4. Created ad-hoc reports to assist with investment presentations.
  5. Improved data accuracy by implementing rigorous validation processes.
  6. Provided training on dashboard tools to new team members.

Achievements

  • Streamlined reporting processes, resulting in a 40% reduction in report generation time.
  • Received recognition for outstanding contributions to financial data management.
  • Successfully launched a new dashboard that increased visibility into investment performance metrics.
⏱️
Experience
2-5 Years
📅
Level
Mid Level
🎓
Education
Bachelor of Science in Finance...

Dashboard Developer Resume

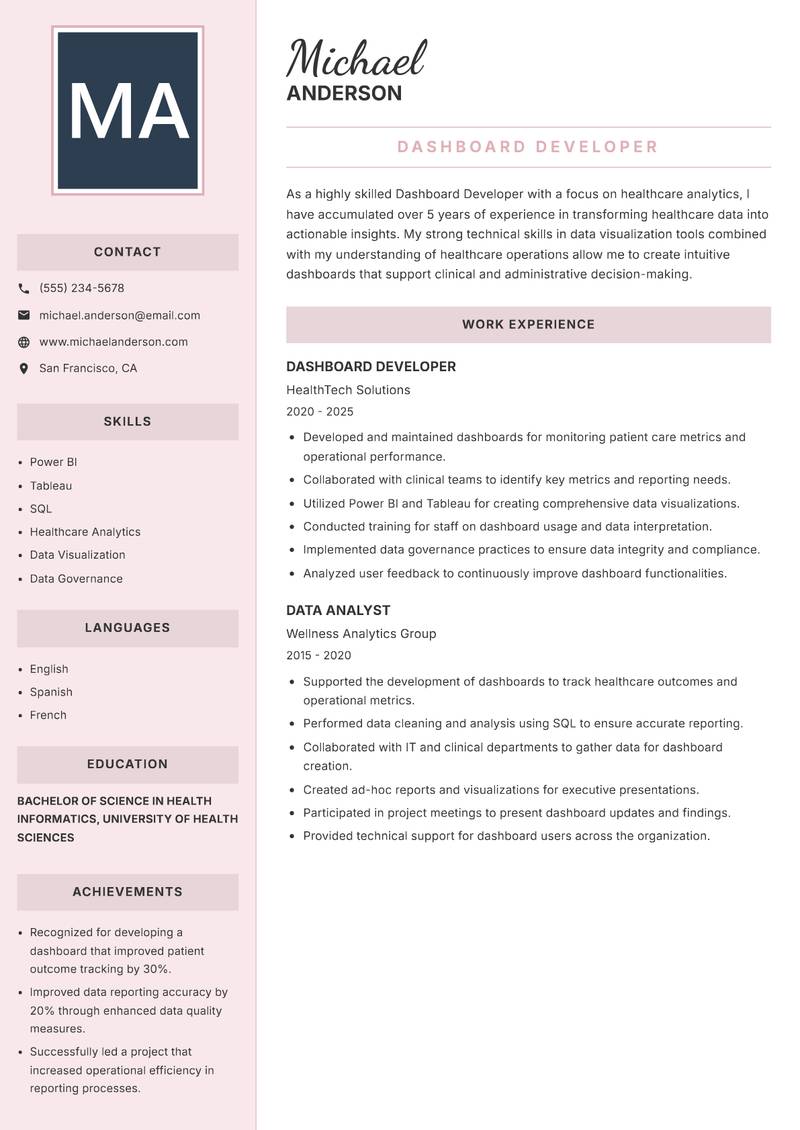
As a highly skilled Dashboard Developer with a focus on healthcare analytics, I have accumulated over 5 years of experience in transforming healthcare data into actionable insights. My strong technical skills in data visualization tools combined with my understanding of healthcare operations allow me to create intuitive dashboards that support clinical and administrative decision-making. I have worked with various stakeholders, including clinicians and administrators, to develop dashboards that track patient outcomes, operational efficiency, and resource utilization. My commitment to improving healthcare delivery through data-driven solutions motivates me to continuously seek innovative approaches to dashboard development. I am adept at ensuring compliance with healthcare regulations while delivering high-quality data visualizations that enhance operational transparency.

Power BI Tableau SQL Healthcare Analytics Data Visualization Data Governance
Dashboard Developer Resume Preview Example
View PDF
  1. Developed and maintained dashboards for monitoring patient care metrics and operational performance.
  2. Collaborated with clinical teams to identify key metrics and reporting needs.
  3. Utilized Power BI and Tableau for creating comprehensive data visualizations.
  4. Conducted training for staff on dashboard usage and data interpretation.
  5. Implemented data governance practices to ensure data integrity and compliance.
  6. Analyzed user feedback to continuously improve dashboard functionalities.
  1. Supported the development of dashboards to track healthcare outcomes and operational metrics.
  2. Performed data cleaning and analysis using SQL to ensure accurate reporting.
  3. Collaborated with IT and clinical departments to gather data for dashboard creation.
  4. Created ad-hoc reports and visualizations for executive presentations.
  5. Participated in project meetings to present dashboard updates and findings.
  6. Provided technical support for dashboard users across the organization.

Achievements

  • Recognized for developing a dashboard that improved patient outcome tracking by 30%.
  • Improved data reporting accuracy by 20% through enhanced data quality measures.
  • Successfully led a project that increased operational efficiency in reporting processes.
⏱️
Experience
2-5 Years
📅
Level
Mid Level
🎓
Education
Bachelor of Science in Health ...

Dashboard Developer Resume

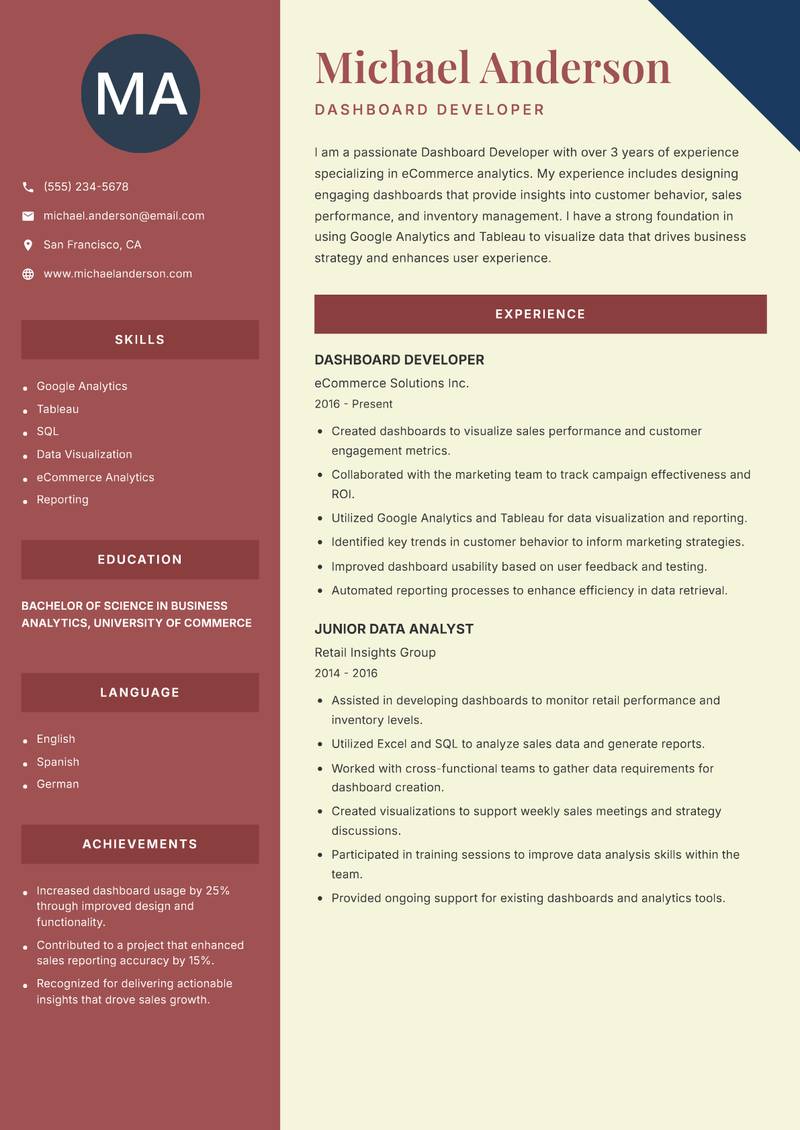
I am a passionate Dashboard Developer with over 3 years of experience specializing in eCommerce analytics. My experience includes designing engaging dashboards that provide insights into customer behavior, sales performance, and inventory management. I have a strong foundation in using Google Analytics and Tableau to visualize data that drives business strategy and enhances user experience. My analytical mindset allows me to identify trends and recommend actionable solutions to optimize eCommerce operations. I excel in collaborative environments and enjoy working with marketing and sales teams to define metrics and improve reporting processes. I am dedicated to continuous learning and staying updated with the latest trends in data analytics and visualization.

Google Analytics Tableau SQL Data Visualization eCommerce Analytics Reporting
Dashboard Developer Resume Preview Example
View PDF
  1. Created dashboards to visualize sales performance and customer engagement metrics.
  2. Collaborated with the marketing team to track campaign effectiveness and ROI.
  3. Utilized Google Analytics and Tableau for data visualization and reporting.
  4. Identified key trends in customer behavior to inform marketing strategies.
  5. Improved dashboard usability based on user feedback and testing.
  6. Automated reporting processes to enhance efficiency in data retrieval.
  1. Assisted in developing dashboards to monitor retail performance and inventory levels.
  2. Utilized Excel and SQL to analyze sales data and generate reports.
  3. Worked with cross-functional teams to gather data requirements for dashboard creation.
  4. Created visualizations to support weekly sales meetings and strategy discussions.
  5. Participated in training sessions to improve data analysis skills within the team.
  6. Provided ongoing support for existing dashboards and analytics tools.

Achievements

  • Increased dashboard usage by 25% through improved design and functionality.
  • Contributed to a project that enhanced sales reporting accuracy by 15%.
  • Recognized for delivering actionable insights that drove sales growth.
⏱️
Experience
2-5 Years
📅
Level
Mid Level
🎓
Education
Bachelor of Science in Busines...

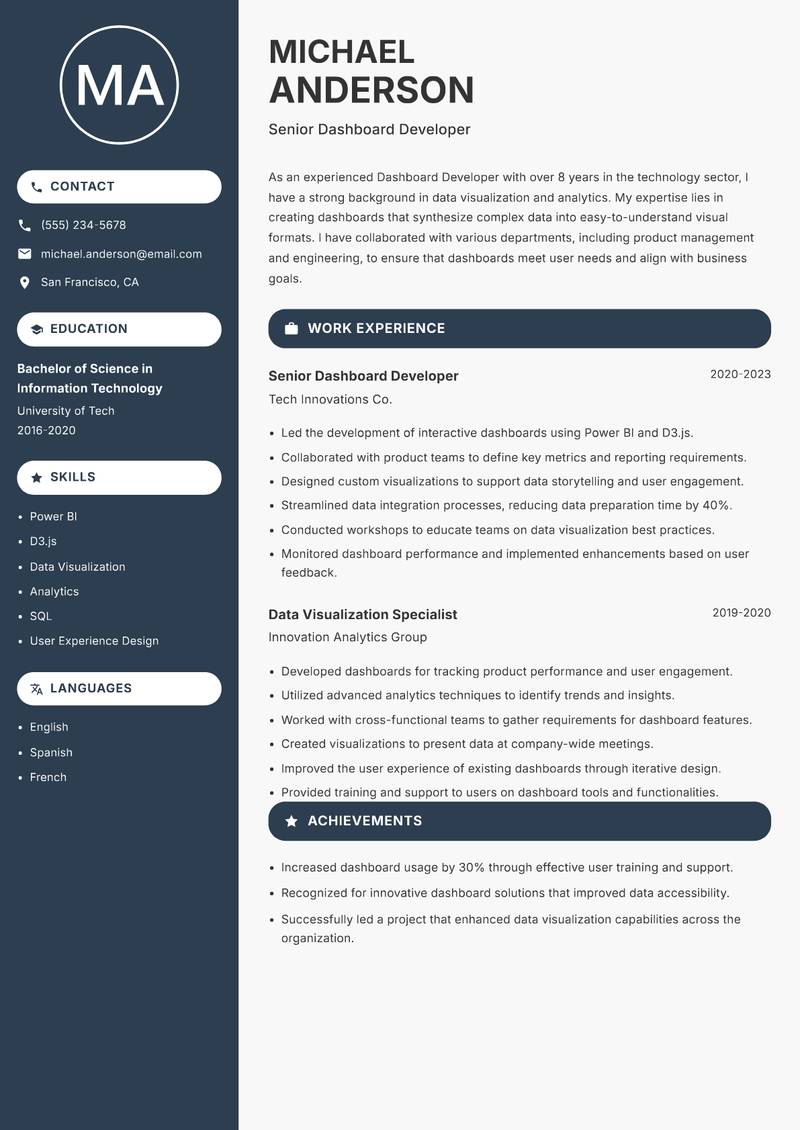
Senior Dashboard Developer Resume

As an experienced Dashboard Developer with over 8 years in the technology sector, I have a strong background in data visualization and analytics. My expertise lies in creating dashboards that synthesize complex data into easy-to-understand visual formats. I have collaborated with various departments, including product management and engineering, to ensure that dashboards meet user needs and align with business goals. My proficiency in tools such as Power BI and D3.js allows me to develop custom visualizations that drive data-driven decisions. I am dedicated to continuous improvement and innovation, constantly seeking new ways to enhance the user experience and deliver meaningful insights through data.

Power BI D3.js Data Visualization Analytics SQL User Experience Design
Dashboard Developer Resume Preview Example
View PDF
  1. Led the development of interactive dashboards using Power BI and D3.js.
  2. Collaborated with product teams to define key metrics and reporting requirements.
  3. Designed custom visualizations to support data storytelling and user engagement.
  4. Streamlined data integration processes, reducing data preparation time by 40%.
  5. Conducted workshops to educate teams on data visualization best practices.
  6. Monitored dashboard performance and implemented enhancements based on user feedback.
  1. Developed dashboards for tracking product performance and user engagement.
  2. Utilized advanced analytics techniques to identify trends and insights.
  3. Worked with cross-functional teams to gather requirements for dashboard features.
  4. Created visualizations to present data at company-wide meetings.
  5. Improved the user experience of existing dashboards through iterative design.
  6. Provided training and support to users on dashboard tools and functionalities.

Achievements

  • Increased dashboard usage by 30% through effective user training and support.
  • Recognized for innovative dashboard solutions that improved data accessibility.
  • Successfully led a project that enhanced data visualization capabilities across the organization.
⏱️
Experience
2-5 Years
📅
Level
Mid Level
🎓
Education
Bachelor of Science in Informa...

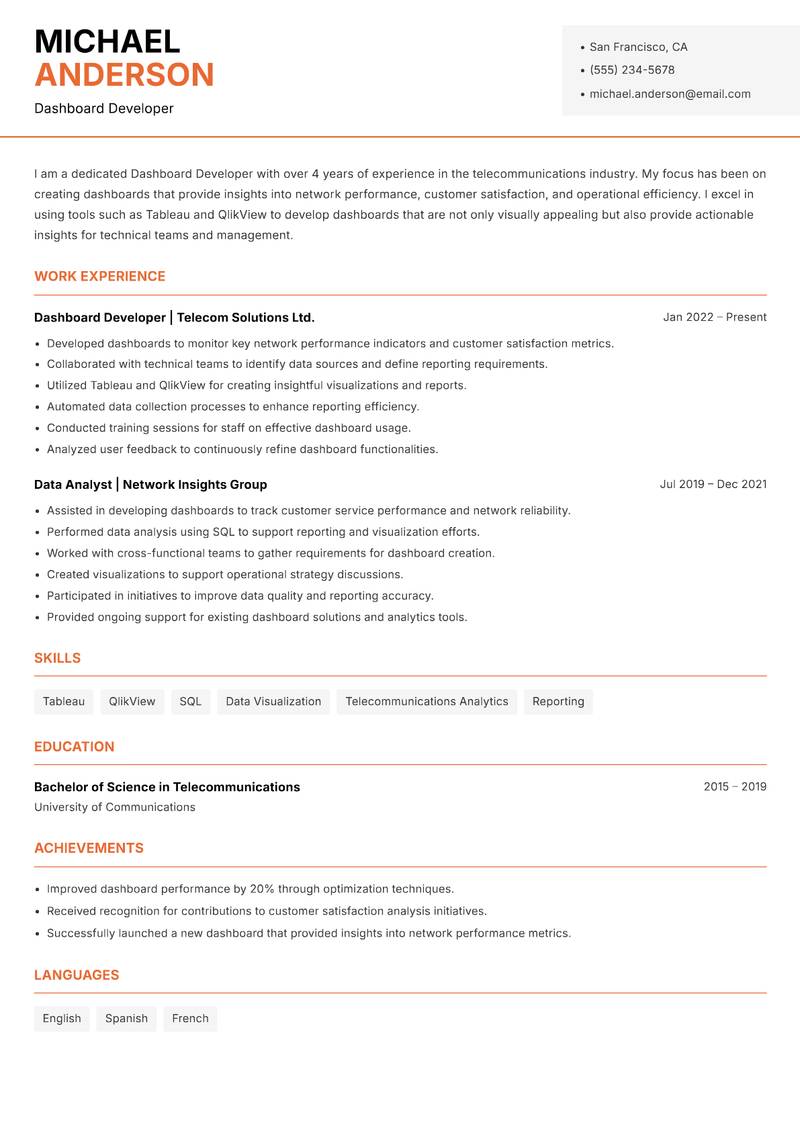
Dashboard Developer Resume

I am a dedicated Dashboard Developer with over 4 years of experience in the telecommunications industry. My focus has been on creating dashboards that provide insights into network performance, customer satisfaction, and operational efficiency. I excel in using tools such as Tableau and QlikView to develop dashboards that are not only visually appealing but also provide actionable insights for technical teams and management. My strong analytical skills and attention to detail have allowed me to effectively communicate complex data in a way that is easy to understand. I am committed to driving improvements in telecommunications operations through data-driven decision-making.

Tableau QlikView SQL Data Visualization Telecommunications Analytics Reporting
Dashboard Developer Resume Preview Example
View PDF
  1. Developed dashboards to monitor key network performance indicators and customer satisfaction metrics.
  2. Collaborated with technical teams to identify data sources and define reporting requirements.
  3. Utilized Tableau and QlikView for creating insightful visualizations and reports.
  4. Automated data collection processes to enhance reporting efficiency.
  5. Conducted training sessions for staff on effective dashboard usage.
  6. Analyzed user feedback to continuously refine dashboard functionalities.
  1. Assisted in developing dashboards to track customer service performance and network reliability.
  2. Performed data analysis using SQL to support reporting and visualization efforts.
  3. Worked with cross-functional teams to gather requirements for dashboard creation.
  4. Created visualizations to support operational strategy discussions.
  5. Participated in initiatives to improve data quality and reporting accuracy.
  6. Provided ongoing support for existing dashboard solutions and analytics tools.

Achievements

  • Improved dashboard performance by 20% through optimization techniques.
  • Received recognition for contributions to customer satisfaction analysis initiatives.
  • Successfully launched a new dashboard that provided insights into network performance metrics.
⏱️
Experience
2-5 Years
📅
Level
Mid Level
🎓
Education
Bachelor of Science in Telecom...

Key Skills for Dashboard Developer Positions

Resume Tips for Dashboard Developer Applications

Strong Action Verbs for Dashboard Developer Resumes

Analyzed · Modeled · Visualized · Optimized · Forecasted · Engineered · Extracted · Transformed · Predicted · Dashboarded · Achieved · Administered · Architected · Assessed

Common Mistakes to Avoid

Experience Levels

How to Write a Dashboard Developer Resume

Browse Dashboard Developer resume examples built around SQL & database querying, tailored for Data & Analytics roles.

A strong Dashboard Developer resume leads with a focused professional summary that names the exact role and your standout achievement. In the experience section, open every bullet with a strong action verb and quantify the result with numbers wherever possible. Highlight your most relevant competencies — especially SQL & Database Querying, Python / R for Data Analysis, and Machine Learning & Statistical Modeling — in a dedicated Skills section positioned early so ATS systems and hiring managers both find it immediately.

For format, most Dashboard Developer roles suit a reverse-chronological layout: most recent position first, working backwards. Keep to one page for under five years of experience, or two pages for senior candidates with a rich project or leadership history. Use clean, ATS-safe fonts (10–12pt), standard section headings (Summary, Experience, Education, Skills), and avoid tables, text boxes, or multi-column layouts that applicant tracking systems cannot parse reliably.
Frequently Asked Questions

What makes a strong Dashboard Developer resume stand out to employers?

A standout Dashboard Developer resume combines role-specific skills with quantified achievements. Name the exact job title in your professional summary, mirror keywords from each job posting, and open every bullet point with a strong action verb followed by a measurable result. Certifications, tools, and domain experience specific to dashboard developer roles should appear prominently near the top.

What skills are most important to include on a Data & Analytics resume?

Recruiters hiring in Data & Analytics consistently look for SQL & Database Querying, Python / R for Data Analysis, Machine Learning & Statistical Modeling, Data Visualization (Tableau, Power BI, Looker). List these in a dedicated Skills section near the top so both ATS systems and human reviewers spot them fast. Mirror the exact phrasing from each job posting wherever possible — many applicant tracking systems match literal strings rather than synonyms.

What is the best resume format for Data & Analytics professionals?

A reverse-chronological format is the standard choice for most Data & Analytics candidates — employers expect to see your most recent role first, working backwards. If you are transitioning into Data & Analytics from a related field, a hybrid format (brief skills summary at the top followed by chronological experience) can bridge the gap effectively. Keep the document to one page for under five years of experience, or two pages for senior specialists.

How do I make my Data & Analytics resume pass applicant tracking systems (ATS)?

Use standard section headings — Summary, Experience, Education, Skills — rather than creative labels that ATS parsers do not recognise. Embed domain keywords such as "SQL & Database Querying" and "Python / R for Data Analysis" naturally inside your experience bullets rather than cramming them into a standalone keyword list. Avoid tables, multi-column layouts, text boxes, headers, footers, and images — these confuse most modern parsers and can cause your resume to be misread or rejected before a human sees it.

What mistakes do Data & Analytics professionals most commonly make on their resume?

The most frequent issue is describing technical processes without tying them to business outcomes. Beyond that, generic objective statements, unquantified achievements, and inconsistent date formatting appear across almost every Data & Analytics application. Fix these by replacing every vague claim with a measurable outcome — specific numbers and named projects add credibility that adjectives cannot.

How long should a Data & Analytics resume be?

One page is appropriate for candidates with under five years of relevant Data & Analytics experience. Two pages are acceptable — and sometimes expected — for senior specialists, managers, or professionals with a strong portfolio of projects, publications, or credentials. Avoid padding to reach a page count: every line should directly support your application for the specific role you are targeting.

Should I include a professional summary at the top of my Data & Analytics resume?

Yes — a two to three sentence summary is the first section most recruiters read. Open with your title and years of Data & Analytics experience, then name your most relevant achievement or specialisation. One proven approach: Quantify every analytical outcome — revenue impact, cost savings, accuracy improvements, or decisions influenced — this level of specificity signals genuine expertise before a recruiter reaches your experience section.

Scroll to view samples